Million-Dollar HDB Flats: What the Data Shows
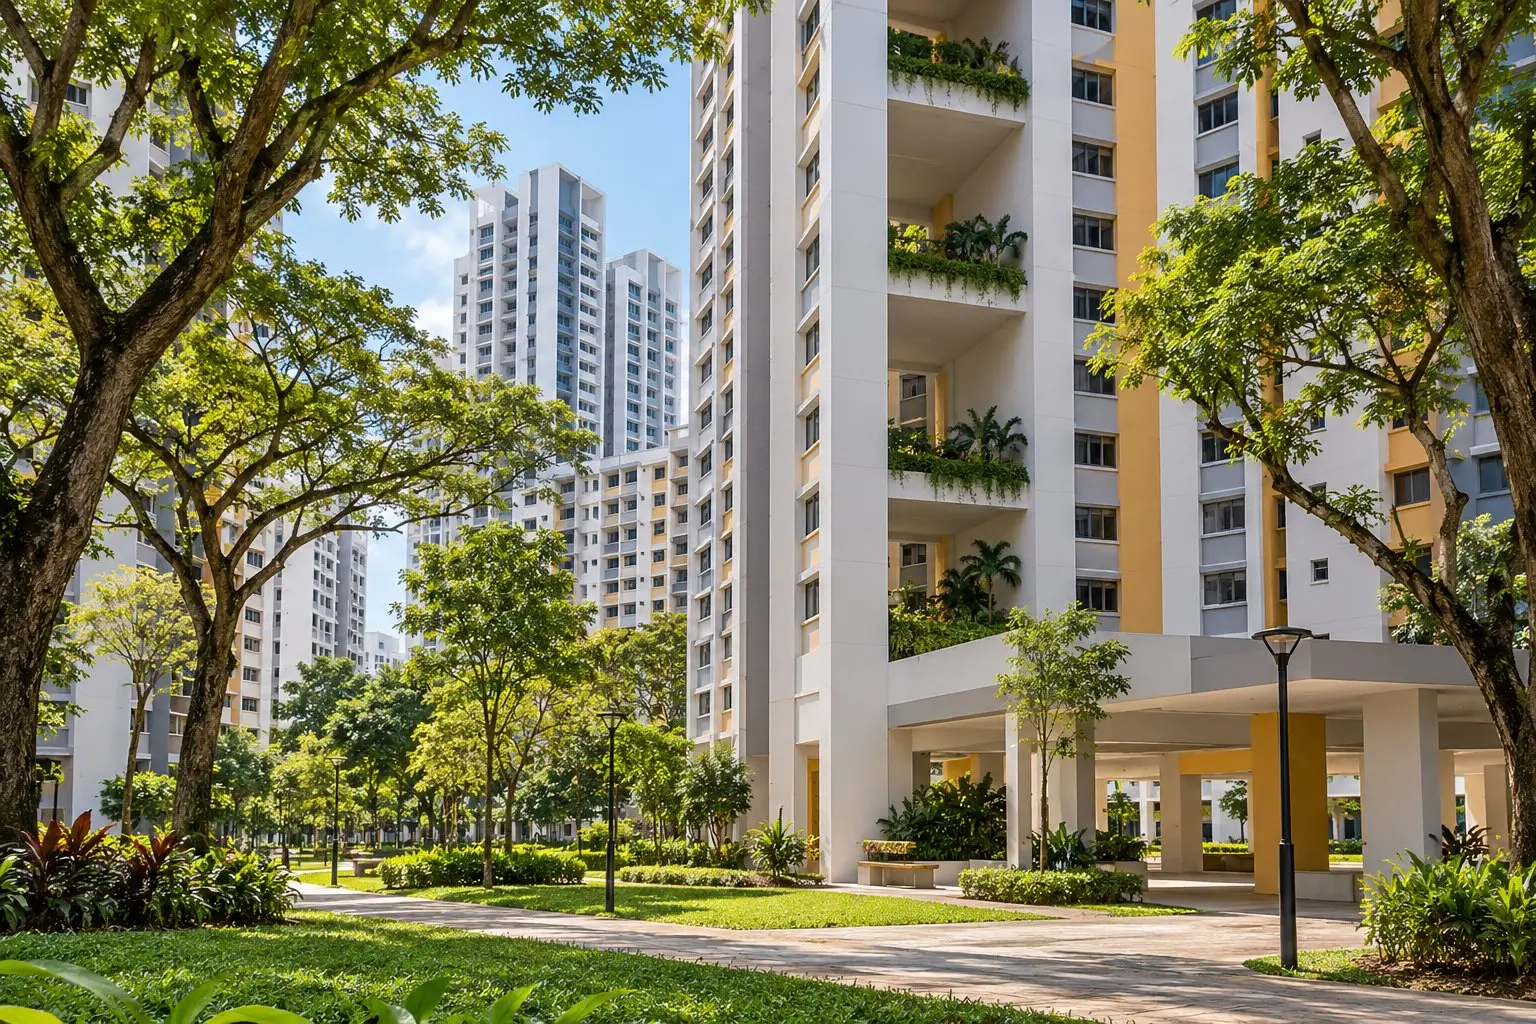
HDB resale flats selling for S$1 million or more rose from 46 in 2017 to 1,735 in the first ten months of 2026 — roughly 8% of all resales this year, concentrated in mature central towns.
On this page9 sections · tap to jump
- 01How many HDB flats cross the million-dollar mark
- 02The trend: rare in 2017, routine by 2026
- 03How big a share of the market
- 04Where the million-dollar flats are
- 05Which flat types hit a million
- 06The current ceiling
- 07What the data does not say
- 08How we counted (method and caveats)
- 09Frequently asked questions
The “million-dollar HDB flat” has gone from a curiosity to a monthly news item. But a headline about one record sale tells you nothing about how common these deals really are. So we counted every one. Using the official HDB resale dataset on data.gov.sg — 243,874 transactions from January 2017 to October 2026 — we flagged each sale at S$1,000,000 or more and broke the results down by year, town and flat type. The scripts and output are kept with our research so the numbers are reproducible, and the raw data updates daily. Here is what the record actually shows.
How many HDB flats cross the million-dollar mark
In the first ten months of 2026, 1,735 resale flats sold for at least S$1 million. For scale, there were just 46 such sales in the whole of 2017. Across the entire 2017–2026 record, 5,723 flats changed hands at seven figures.
That growth is not a straight line — it was slow until 2020, then accelerated sharply. The rest of this page separates the trend, the share of the market, the geography and the flat types, because each answers a different question a buyer or seller actually has.
The trend: rare in 2017, routine by 2026
Million-dollar sales were a rounding error for years and then climbed every single year from 2021. The count by year:
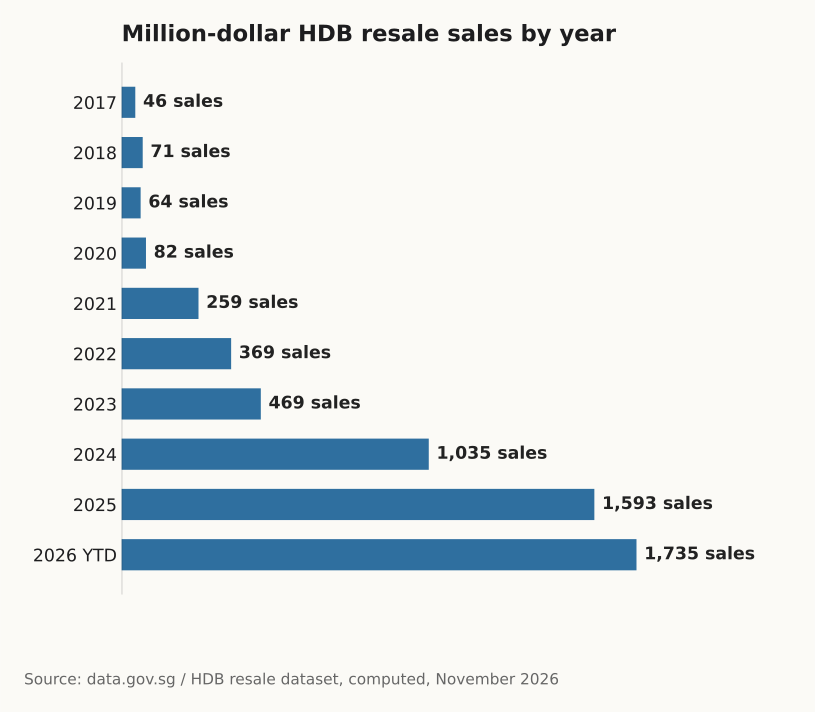
HDB resale flats sold at S$1,000,000 or more, by year. 2026 is January-October.
| Year | Million-dollar sales | All resales | Share |
|---|---|---|---|
| 2017 | 46 | 20,509 | 0.22% |
| 2018 | 71 | 21,561 | 0.33% |
| 2019 | 64 | 22,186 | 0.29% |
| 2020 | 82 | 23,333 | 0.35% |
| 2021 | 259 | 29,087 | 0.89% |
| 2022 | 369 | 26,720 | 1.38% |
| 2023 | 469 | 25,754 | 1.82% |
| 2024 | 1,035 | 27,832 | 3.72% |
| 2025 | 1,593 | 25,084 | 6.35% |
| 2026 (Jan–Oct) | 1,735 | 21,808 | 7.96% |
The jump from 2023 to 2024 — more than double — is the clearest break in the series. And 2026 is notable for a simple reason: with two months still to be registered, it has already overtaken the full-year 2025 total. The pace, not just the level, is still rising.
How big a share of the market
Even now, million-dollar flats are the exception, not the rule. Over the full 2017–2026 record they make up 2.35% of all recorded resales. The share is rising fast — from under 1% before 2021 to roughly 8% so far in 2026 — but more than nine in ten resale flats still change hands below the million-dollar line. When you read that “another HDB flat sold for over a million”, remember it sits in the top few per cent of the market, not the middle of it.
Where the million-dollar flats are
They cluster in mature, central estates — not the newest towns. Across all years, the leaders are:
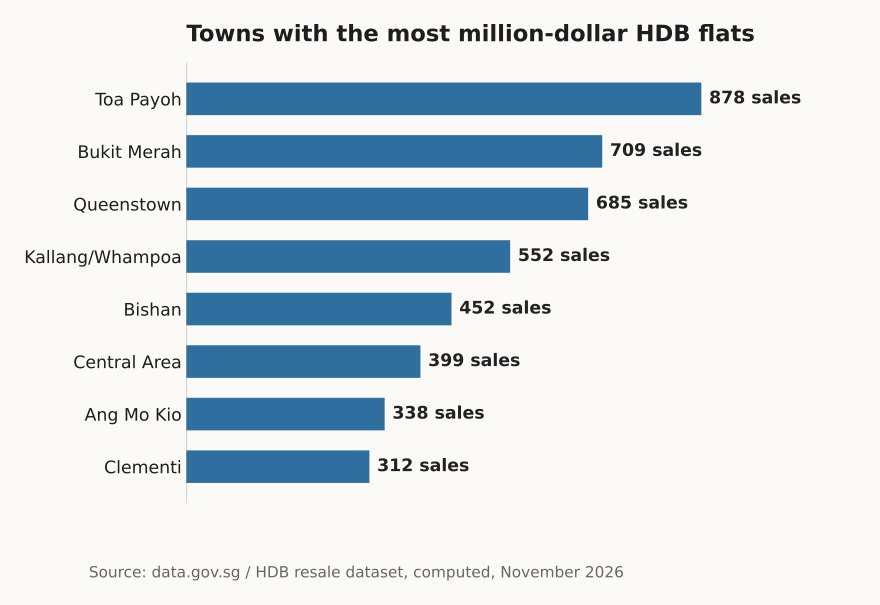
Total million-dollar resale sales by town, 2017-2026.
| Town | Million-dollar sales (2017–2026) |
|---|---|
| Toa Payoh | 878 |
| Bukit Merah | 709 |
| Queenstown | 685 |
| Kallang/Whampoa | 552 |
| Bishan | 452 |
| Central Area | 399 |
| Ang Mo Kio | 338 |
| Clementi | 312 |
| Geylang | 190 |
| Tampines | 187 |
Toa Payoh, Bukit Merah and Queenstown alone account for well over a third of the 5,723 total. These are established towns close to the city, with good transit and, in several cases, sought-after larger or newer flats within an older estate. The 2026 year-to-date ranking looks almost identical — Toa Payoh (270), Queenstown (237) and Bukit Merah (202) again lead — with Bedok and Tampines now also producing three figures of seven-figure sales, a sign the phenomenon is spreading outward from the centre.
Which flat types hit a million
Larger flats dominate the all-time list, but the mix is changing. Across 2017–2026:
| Flat type | Million-dollar sales | Share |
|---|---|---|
| 5 ROOM | 2,330 | 40.7% |
| 4 ROOM | 2,030 | 35.5% |
| EXECUTIVE | 1,324 | 23.1% |
| 3 ROOM | 21 | 0.4% |
| MULTI-GENERATION | 18 | 0.3% |
5-room and executive flats were the original million-dollar flats — they are simply bigger. But look at the recent split: in both 2025 and 2026 the 4-room flat overtook the 5-room as the most common seven-figure type. In 2026 year-to-date it was 4-room 746, 5-room 616 and executive 360. A four-room flat crossing a million says more about location and remaining lease than about floor area — which is exactly why the “which town” question above matters more than “how big”.
The current ceiling
The single highest resale price in the dataset is S$1,818,000, for a 5-room flat in Queenstown registered in October 2026. Records like this are what drive headlines, but they are genuine outliers: the vast majority of million-dollar flats sit much closer to the S$1 million line than to the top of the range. One record sale is a data point, not a market.
What the data does not say
A rising count of million-dollar flats does not mean the typical HDB flat now costs a million dollars. The median resale flat remains far below that level, and most towns record very few seven-figure sales. The figures here measure the top slice of the market widening, not the whole market relocating to it. For the broad trend in prices, the official HDB Resale Price Index is the better gauge than any single transaction, and town-level medians are published separately. If you are pricing a specific flat, comparable recent sales in the same block and flat type matter far more than any citywide count — our guide on how to price your resale flat walks through that.
How we counted (method and caveats)
We pulled the complete dataset “Resale flat prices based on registration date from Jan-2017 onwards” via the data.gov.sg datastore API and counted every record with resale_price of S$1,000,000 or more, grouped by calendar year, town and flat type. Three official caveats apply, and they are baked into the dataset itself:
- Transactions exclude resales that “may not reflect the full market price such as resale between relatives and resale of part shares” — so every figure is an arm’s-length deal.
- Prices “should be taken as indicative only”, as agreed prices depend on many factors.
- Records are keyed to registration date, not the date the option was granted, so a sale appears when it is registered.
Because the data is registration-based and refreshed daily, counts for the most recent months keep rising as late registrations come in. If you are weighing a resale against a new flat, the BTO versus resale decision depends on far more than headline prices.
Frequently asked questions
Is 2026 really a record year for million-dollar flats? By count, yes — the January–October total already exceeds the full-year 2025 figure, with two months still to register. The share of resales at seven figures, roughly 8%, is also the highest on record.
Does a million-dollar flat mean I overpaid? Not by itself. These are gross agreed prices for specific flats, usually in central, well-located estates with desirable attributes. Price any flat against recent comparable sales in the same block and type, not against a citywide count.
Are CPF grants included in these prices? No. The dataset records the agreed resale price only. Housing grants that eligible first-timers may receive are separate and would reduce the net cost; they are not deducted here.
Where can I check prices for my own town or block? Use the official HDB resale datasets on data.gov.sg: the transaction-level file for individual sales, and the “Median Resale Prices by Town and Flat Type” dataset for town-level medians.
Is this the whole HDB market? No — it is resale transactions only, from January 2017 onward. New flats sold directly by HDB (BTO/SBF) are priced and recorded separately and are not in this dataset.
Sources
- Resale flat prices based on registration date from Jan-2017 onwards — data.gov.sg / Housing & Development Board (as of November 2026)
- HDB Resale Price Index (1Q2009 = 100), Quarterly — data.gov.sg / Housing & Development Board (as of November 2026)
- Median Resale Prices for Registered Applications by Town and Flat Type — data.gov.sg / Housing & Development Board (as of November 2026)
- Private Residential Property Transactions in the Whole of Singapore, Quarterly — data.gov.sg / Urban Redevelopment Authority (as of November 2026)