Private Home Prices by Region (CCR/RCR/OCR): URA Data
URA's official index shows private home prices rose 1.4% in Q3 2026, but the regions split sharply: suburban OCR jumped 2.3%, city-fringe RCR was flat, and prime CCR edged up just 0.3%.
On this page10 sections · tap to jump
- 01The headline: prices up 1.4% in Q3 2026
- 02CCR, RCR and OCR: how the regions are defined
- 03The three regions moved in different directions
- 04The index values, region by region
- 05Landed homes are outrunning condos
- 06The one-year picture
- 07Resale is driving the market
- 08How URA measures prices (and its limits)
- 09Find your own district or project
- 10Frequently asked questions
When people ask about private home prices “by district” in Singapore, the honest answer is that the official price gauge does not work that way. The Urban Redevelopment Authority (URA) publishes a Property Price Index (PPI) that groups all non-landed private homes into three market segments — the Core Central Region (CCR), the Rest of Central Region (RCR) and the Outside Central Region (OCR). Districts roll up into those regions. So this page uses URA’s own numbers to show what actually moved in the latest quarter, how to map districts to regions, and where to look when you need street- or project-level detail. All figures are from URA’s 3rd Quarter 2026 statistics, released 23 October 2026.
The headline: prices up 1.4% in Q3 2026
Overall private residential prices rose 1.4% quarter-on-quarter in Q3 2026, up from a 0.5% rise in Q2. On URA’s index (1Q2009 = 100), the all-residential measure moved from 219.4 to 222.5. Over the first three quarters of 2026, prices increased by an average of 0.9% per quarter — the same pace as the same period in 2025.
That single number hides most of the story, though, because the three regions behaved very differently. The rest of this page pulls them apart.
CCR, RCR and OCR: how the regions are defined
The three segments are geographic, and URA defines them precisely. The Core Central Region (CCR) “comprises Postal Districts 9, 10, 11, Downtown Core Planning Area and Sentosa” — the prime, traditionally most expensive areas. The Rest of Central Region (RCR), the city fringe, “comprises the area within Central Region that is outside” those CCR districts. The Outside Central Region (OCR) covers everywhere outside the Central Region — the suburban “mass market”.
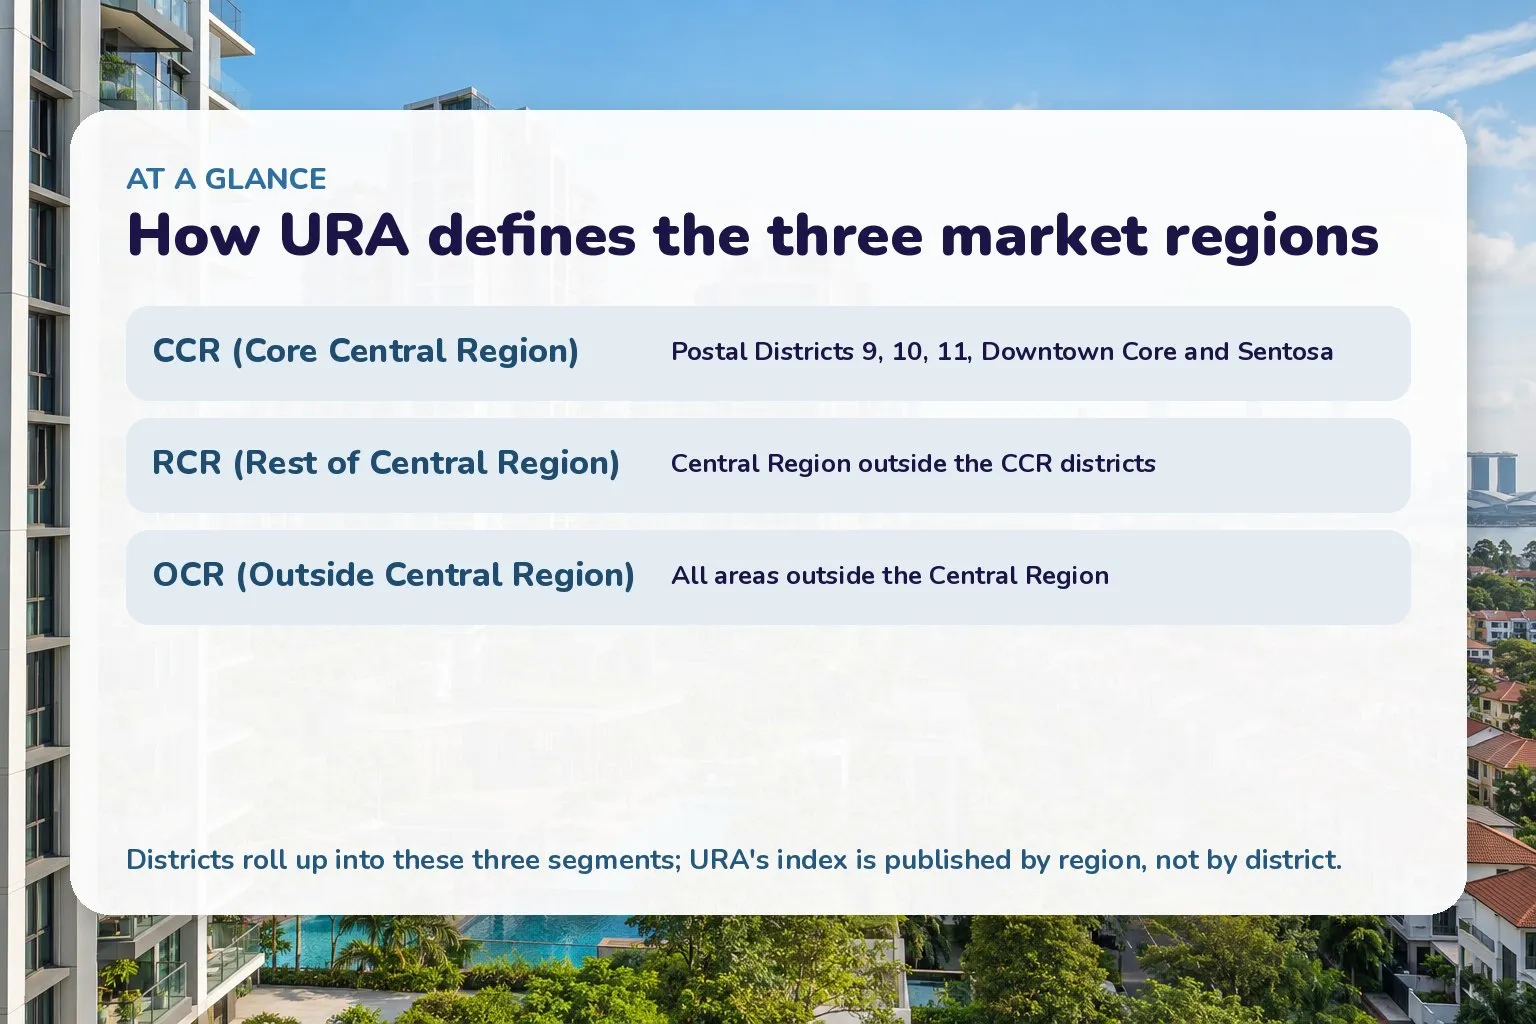
URA’s official definitions of the three private-home market segments.
The three regions moved in different directions
In Q3 2026 the suburbs led and the prime core stalled. URA reports that non-landed prices rose 2.3% in the OCR, were unchanged (0.0%) in the RCR, and edged up just 0.3% in the CCR. That is almost a mirror image of the previous quarter, when the CCR had risen 1.8% and the OCR had slipped 0.1%.
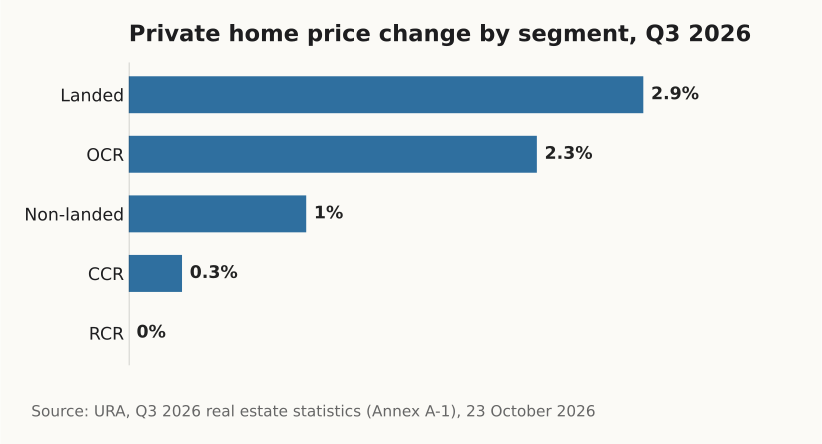
Quarter-on-quarter change in URA’s price index by segment, Q3 2026.
The divergence matters for buyers. A strong overall index can be driven almost entirely by one segment. In this quarter, a suburban upgrader faced a very different market from someone shopping in the prime districts, where prices barely moved. For the trade-offs of buying private versus public housing, see our breakdown of private property versus HDB costs.
The index values, region by region
Here are the actual index points behind those percentages, so you can see the levels rather than just the moves:
| Segment (1Q09 = 100) | Q2 2026 | Q3 2026 | Q-o-q change |
|---|---|---|---|
| All residential | 219.4 | 222.5 | +1.4% |
| Landed | 258.4 | 265.9 | +2.9% |
| Non-landed | 210.6 | 212.7 | +1.0% |
| CCR (non-landed) | 161.5 | 162.0 | +0.3% |
| RCR (non-landed) | 226.2 | 226.2 | 0.0% |
| OCR (non-landed) | 271.1 | 277.3 | +2.3% |
One thing jumps out: the OCR index (277.3) is far higher than the CCR index (162.0). That does not mean suburban homes cost more than prime ones — they do not. Each region’s index is anchored to its own 2009 base of 100, so the number shows how much prices have grown since then, not the price level. OCR prices have simply risen much more, in percentage terms, since the 2009 base than CCR prices have.
Landed homes are outrunning condos
Landed property is the strongest part of the market in 2026. Its sub-index rose 2.9% in Q3 2026 to 265.9, after a 2.5% gain the previous quarter — outpacing the 1.0% rise for non-landed homes. Because landed housing is a small, supply-constrained slice reserved largely for citizens, a handful of high-value deals can move its index sharply. If you are weighing property structures and tenure, our guides on executive condos versus private condos and freehold versus leasehold cover the trade-offs.
The one-year picture
Zooming out past a single quarter changes the ranking. Over the full year 2025, URA’s index rose 3.3% overall — and the pattern was the reverse of Q3 2026. Prime and fringe areas led: the CCR rose 1.9% and the RCR 1.6%, while the OCR rose 3.2% and landed property jumped 7.6%. The 4Q2025 index levels were 157.7 (CCR), 227.1 (RCR) and 265.6 (OCR).
Resale is driving the market
The way homes are being bought has shifted toward resale. There were 3,801 resale transactions in Q3 2026 — about 73.9% of all private sale transactions, up from 62.0% the previous quarter. Developers, by contrast, sold just 1,183 new units (excluding executive condos), down from 2,141 in Q2. With fewer new launches, buyers leaned on the resale market, which also helps explain why existing-project prices held up in segments with no new launch.
How URA measures prices (and its limits)
URA’s index is not a simple average of transaction prices. Since the first quarter of 2015 it has used a “stratified hedonic regression methodology”, which controls for differences in attributes such as unit size and age so that the index reflects genuine price change rather than a change in the mix of what sold. The underlying data is “compiled from caveats lodged at Singapore Land Authority (SLA), supplemented with Stamp Duty data from” IRAS, plus nett prices supplied by developers for new sales.
Two limits are worth holding onto. First, there is no official per-district price index in the quarterly release — the finest published cut is the three regions. Second, a quarterly flash estimate (issued about three weeks early) can differ from the final figure once more caveats are in. URA states its Q3 2026 figures are “accurate as of 23 October 2026”.
Find your own district or project
Because the index stops at the regional level, district, street and project prices come from a different, transaction-level tool. URA’s Private Residential Transaction Search lets you look up actual caveats by project and district, and its time-series service holds the historical indices. For market-wide counts, the quarterly transaction dataset on data.gov.sg is open and free. If you are tracking the public-housing side too, our data page on million-dollar HDB resale flats applies the same transaction-level approach to HDB.
Frequently asked questions
Does URA publish prices by postal district? Not as an index. The quarterly PPI stops at three regions (CCR, RCR, OCR). For district- and project-level prices you use URA’s transaction search, which shows actual caveated prices rather than a smoothed index.
Why is the OCR index higher than the CCR index if the city centre is pricier? Because each region’s index is based on its own 2009 value of 100. The index measures growth since 2009, not the price level. OCR prices have grown more in percentage terms, so its index number is higher even though CCR homes cost more per square foot.
What is the difference between the flash estimate and the full figures? The flash estimate is released about three weeks before the full set, using data up to mid-quarter. It can be revised: for Q3 2026 the overall 1.4% held, but the regional splits were updated in the final 23 October release.
How fresh is this data? These are the final 3rd Quarter 2026 statistics, accurate as of 23 October 2026. The next full release is quarterly; a flash estimate for the following quarter comes first.
Where do the numbers come from? From caveats lodged with SLA, stamp-duty records from IRAS, and developers’ nett new-sale prices, combined using URA’s stratified hedonic regression method.
Sources
- Release of 3rd Quarter 2026 real estate statistics — Urban Redevelopment Authority (as of November 2026)
- Comparison of property price index for 2nd Quarter 2026 and 3rd Quarter 2026 (Annex A-1) — Urban Redevelopment Authority (as of November 2026)
- Coverage and Methodology — REALIS — Urban Redevelopment Authority (as of November 2026)
- Comparison of property price index for 2024 and 2025 (Annex A-1b) — Urban Redevelopment Authority (as of November 2026)
- Private Residential Property Transactions in the Whole of Singapore, Quarterly — data.gov.sg / Urban Redevelopment Authority (as of November 2026)